
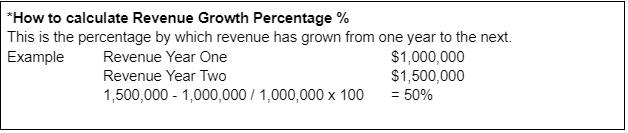
In our previous blog we introduced you to the ‘7 Key Numbers That Drive Profit and Cash Flow’. Here is more detail about Key Number 1: Revenue Growth Percentage%*
Business owners focus a lot of attention on Revenue.

“Let’s make more sales and the profit will look after itself!”
Heard that before? Making sales is obviously important … but what is just as important … is what those sales cost you to make and also … what they cost you to fund.
As soon as you sell something, and often well beforehand, there are costs involved e.g. goods for sale, freight, labour, overheads etc. It’s critical to know these costs, because if they exceed your price, then obviously you are making a loss and heading for cash-flow problems.
This driver is possibly the most important of all the seven, because business growth is often the killer of small businesses. What! Go back a second! It’s because there are many other numbers as well as Revenue that relate to profitability.
If the other numbers aren’t well managed, revenue growth will just exacerbate cash-flow issues. If it’s not a good situation … it won’t get better with more sales … but it can get much worse. Revenue Growth is a cause for celebration, but it’s also cause for attention to other ‘Key Drivers’ because more sales can cause cash-flow problems.
The age-old question accountants get asked by their business clients is:
“How come I’ve made more sales and profit but I don’t have any more cash?”
The answer to this lies in the ‘Cash Flow Cycle’ diagram following. 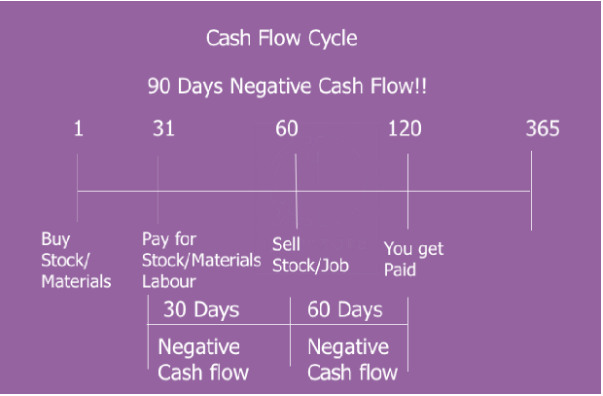
The ‘Cash Flow Cycle’ is often not well understood by business owners … until the business starts to grow and they begin to experience a cash flow squeeze. Let’s explain how it works. In the image above you can see a timeline of 365 days.
It shows: before you can sell anything you have to buy something i.e. stock or it could be labour and materials.
Depending on your sales cycle i.e. how long the stock sits in store, you may hold onto stock for 60 days.
Depending on the terms you get from suppliers you may have to pay for that stock after 30 days – which means you have 30 days negative cash-flow.
That is you’ve had to pay for it 30 days before you sold it.
Depending on your accounts receivable management you could wait 60 days to get paid – which adds another 60 days negative cash-flow.
This adds up to 90 days negative cash-flow!
This is your money! You have paid for the stock on day 30. You have sold the goods on day 60 … and then given credit to your customer who has taken 60 days to pay for it.
Effectively another party is using your money to fund their business. What this illustration shows is that the money due to you, has been somewhere other than your bank account for 90 days.
That is, it is in the bank account of your supplier and of your customer.
This can cause a BIG problem when growth occurs. You now have to buy more stock and find more working capital… and the issue just gets bigger!
If a business isn’t working to minimise these things, that is the number of days stock that is held … and then the number of days a customer is taking to pay … then the problem just gets worse when sales grow.
Sometimes businesses get so focused on increasing sales that the issues of stock movement and accounts receivable just get ignored, or it’s viewed as not considered worth investing in.
This is the reason growth can often kill a profitable business!
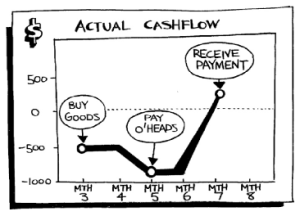
A lot happens to cash on its journey from the sale to your bank account. If you are planning to grow your business, obviously it helps to understand this phenomenon and put in place measures to manage it.
Ways to manage revenue growth and see where the profit and losses are:
- More sales could mean more capital required. Understand the impact of revenue on the other numbers. More sales may mean more working capital is required.
- Account for different product/services separately. Don’t lump all revenue into one account in your accounting system. Split it up by product/service groups, divisions, branches etc.
Also split the costs related to each, so you can see which ones are profitable and which aren’t.
- Find what categories make you money. Once you know which categories are profitable and which aren’t, you can work on maximizing the profits and learning from mistakes where losses are occurring.
- Measure profitability by jobs. Keep track of labour, materials etc. on jobs, so that you can compare to revenue and see which jobs are profitable and which aren’t.
By making small but sustainable changes to these numbers… as part of a plan… the results can be amazing!
Look out for our next blog post for more detailed information about each of the Seven Key Numbers and ways to improve them.
If you don’t want to wait for the next blog post and you’re keen to get started improving your Seven Key Numbers right now… Download our eBook ‘The Seven Key Numbers that Drive Profit and Cash Flow’